Open Letter to Max Martin, Author India
Disasters Report, 2010
Dear Max,
A mutual friend forwarded to me the draft of
a chapter you are presently writing on Environment and Disasters in the India
Disasters Report (IDR) 2010. This is the same one you circulated as an email,
within the Disaster Management and Climate Change Community of Solution
Exchange, an UNDP initiative.
I am pleased to note that you are one of the
authors of the next edition of IDR. I remember the first edition of the book
was of edited by the duo - Dr. PV Unnikrishnan and S Parasuraman - both very
well respected researchers within the humanitarian field. I seem to have
misplaced my personal copy of the book, but as per my recollection, it had no
global warming bias then. However, I found a strong one running entirely
through your draft. As a climate skeptic within the humanitarian community, I
would like to register my reactions to the contents your draft through this
blog post.
While the critique itself could be found
below this letter, please note that the passages culled out from your draft for
reactions are in inverted commas, white
italics.
In your circulation note, you described the
intent of your paper as one attempting to argue, “That environmental disasters can be triggered, fueled, and exacerbated
by human interventions.” My critique should make it evident that
your draft succeeded in none of these outcomes. By simply re-labeling natural
variations as AGW induced climate change, you have done no justice to either of
these two phenomena.
The monsoons for example, by character,
exhibit a wide range of natural variability on the spatial, temporal,
intra-seasonal, inter-annual and decadal scale. The monsoon has always had its
natural vagaries and it is going to show them in future too. Nothing in your
draft paper adequately explains or provides empirical evidence that “climate change” has created a totally
new set of variability of monsoons that exacerbate its natural disaster
potential. Overplaying natural variations in the weather diverts attention from
the real issues and challenges within the humanitarian arena.
We in the NGO sector have long permitted the
IPCC assessment reports to be our purveyor of truth on issues as serious as
climate change. Now Climategate” (dubbed the biggest scientific scandal of all
times) along with the associated collapse of the credibility of the IPCC have
taken a toll on this trust. IDR 2010 therefore stands on the stairway of a
clear choice before you. Their emerging trail of fraud and deceit should have
opened eyes for review of positions. But there is no evidence of this in your
draft paper. It simply regurgitates the same claims of the discredited IPCC,
offering no fresh perspectives. "Climate change" is presented as a
totally scary phenomenon with no plus side. The changing inter-regional
rainfall distribution patterns are attributed by warmists to "climate change". Assuming it
as so, I argued, this is beneficial to India.
The physical, chemical and biological
processes going on in the climate system are not yet completely understood or
well modelled by scientists. Therefore in the description of climate change and
their impacts, there are debates in the scientific community as well as myths
in the public perception. But your draft fails to capture these intricacies.
IDR, being a NGO publication, perhaps want to
be politically correct. But what kind of cause is this, if it perverts science
itself? Your draft succeeded in repeating the tactics of the IPCC. Back in
1989, future Fourth Assessment Report (AR4) Working Group 2 (WG2) IPCC- lead
author Stephen Schneider disclosed such tactics of climate alarmism to Discover
magazine:
”To capture the public imagination, we have to offer
up some scary scenarios, make simplified dramatic statements and little mention
of any doubts one might have. Each of us has to decide the right balance
between being effective, and being honest.”
Warm regards.
Rajan Alexander
Development Consultancy
Group
Floods in Mumbai
& Rajasthan
“The floods in Mumbai and Rajasthan in 2005 and 2006
respectively are indications of things to come. In Mumbai, the rains were so
intense that they paralyzed the city. Santa Cruz area received about 944 mm
rain on a single day. This is a little less than half of the annual rainfall
that Mumbai gets on an average. The following year, some desert villages of
Barmer in Rajasthan recorded 577 mm rain in three days— more than double the
annual average. It rained so heavily here that it changed village landscapes.”
The floods of Mumbai and Rajasthan are
indicators of things to come??? Such language at once rules you out as a
scientist leave alone a climatologist. Theirs is always a language punctuated
with probabilistic nuances and full of caveats, particularly when giving a
prediction. The clear giveaway that you probably an environmental journalist,
which you are basically, is that you people always manage to sound so
definitive and authoritative, even though lacking the credentials.
Both Mumbai (2005) and Barmer (2006) were “cloudbursts” - a freak phenomenon or an
extreme event for both these locations, though cloudbursts are a common
phenomenon mostly in places within the Himalayan region like states like
Himachal Pradesh. A cloudburst is sudden heavy rainfall having a fall rate
equal to or greater than 100 mm (4.94 inches) per hour. The air currents
normally rush upwards in a rainstorm to hold up a large amount of water. If
these currents suddenly were to cease, the entire amount of water descends on
to a small area with catastrophic force suddenly, causing a disaster due to a
rapid condensation of the clouds. They occur most often in desert and
mountainous regions rather than a coastal city like Mumbai.

Rainfall readings for Mumbai 2005 and the
last record year in 1974 are summarized in the table. It makes evident that it
is not unusual for Mumbai to receive heavy rains during the month of July. 2005
if different was only because rainfall was triggered by a cloudburst.
However, not very well known, Vihar Lake a
new weather station, actually received higher rains than Santa Cruz. For Colaba
in 2005, the rainfall received was nowhere near its record levels but in terms
of flood impact was almost as severe as Santa Cruz. Five years earlier, on 13
July 2000, Mumbai recorded rains, with the exception of Santa Cruz, was even
higher than those experienced in 2005 - Vasai 49 cm, Thane 45 cm, Santa Cruz 37
cm and Colaba 25 cm – but Mumbai still coped the floods much better than in
2005.
Obviously, there was something more happening
than simply “rains
paralysing the city” as you put
in. Mumbai was in fact hit by a double whammy. The city was virtually inundated
by high rainfall triggered by a cloudburst on one hand; and faced simultaneous
inflows from a high tide (nearly 5m) on the other hand. Storm water could not
drain out, as the level of the sea was higher.
Moreover, since the level of the sea was
higher, seawater began to add to the level of storm-water. It must be kept in
mind that huge chunks of Mumbai are land reclaimed from the sea – this makes
them vulnerable to high tide invasions. Consequently high rains alone may not
pose a huge disaster risk for the city. It is when high rainfall combines with
high tide above 4.70m that the city becomes vulnerable to a disaster as seen in
2005.
Now let us take up the case of Barmer by
putting it in perspective. Barmar is in the Thar Desert in Western Rajasthan.
The natural vegetation comprises of sparse, sporadic tropical thorn forest. Its
topography lends itself for high runoff and erosion hazard during stormy
cloudbursts. The year before the floods, Barmer experienced extreme drought,
receiving only 102 mm rainfall. Previous years were drought years too. 2006 was
a better year. It received 219 mm rainfall until August 15 but 577mm of
rainfall was recorded between August 19 and 23.
What else can a cloudburst do but create
massive floods under these conditions? The area has no or little vegetation, no
tradition of drainage or water collection systems, as the annual rainfall is
too meagre. But since annual rainfall is increasing along Western Rajasthan,
all this may change over time.
True in Barmer, the disaster caused extensive
damage to life and property. It also temporarily rendered homeless over a
million people in Jaisalmer and Barmer districts. Your draft mentions, “Heavy rains changed the
village landscape”. Unfortunately, it does not further elaborate on this
post-disaster change, leaving it to the reader’s imagination after putting a
scare into their mind – 944 mm rain, half Mumbai’s annual average blah, blah!
But this is how one NGO media report described how the rhythm of desert
life for communities that had combated drought and water shortage all their
life are now all changing for the better:
“After the surprise flooding of Barmer and other arid parts of western
Rajasthan, scientists believe all this water will change not only the look of
this desert region but also its ecology... The floods have created at least
three large lakes - in Kawas, Malwa and Uttarlai - all in Barmer district, and
each covering 7-8 sq km. NGO field-workers involved in conservation and water
harvesting estimate that there are more than 20 new water bodies in the
Barmer-Jodhpur region. Several water channels or natural drains have also shown
up after the flooding.”
Rainfall
“In the Indian context, emerging climate stressors include a rise in
frequency and intensity of extreme rainfall events (Goswami et al. 2006;
Rajeevan and Guhathakurta 2007)....
There is a 10 per cent increase per decade in the level of heavy rainfall
(over 100 mm per day) activity since the early 1950s, whereas the number of
very heavy events (over 150 mm a day) has more than doubled, indicating a large
increase in disaster potential. In spite of considerable year-to-year
variability, there are significant increases in the frequency and the intensity
of extreme monsoon rain events in central India over the past 50 years (Goswami
et al 2006).
This suggests enhanced risks associated with extreme rainfall over India
in the coming decades. Heavy rains can result in flash floods, landslides, and
crop damage and these in turn can affect the local ecology and economy.”
Your Ref:
Increasing Trend of Extreme Rain Events over India in a Warming Environment,’
Science, Goswami et al (2006).
The title of this study, referred by your
paper is misleading. Goswami and colleagues at the Indian Institute of Tropical
Meteorology looked at readings from a grid of 1800 gauges covering only a chunk
of central and eastern India. However, the title gives an impression that their
study covers the entire country. Though this is a commonly cited study, it has
been also highly criticized for its weak methodology:
- Monsoons in central India unlike eastern India is
also affected by a host of factors, including its proximity to the Himalayas.
- The research does not reveal any new light on the
frequency of flash floods, such as the Mumbai deluge of 2005 as the data is
based on simply averaging rainfall across an area 100 kilometres square, making
it difficult to say anything about flash floods in particular areas.
- Do we need to be alarmed of a 10% increase per decade
in heavy rainfall (100 mm) or the doubling of heavy events (over 150 mm per
day)? The data is drawn from central India but Goswami makes the cardinal
mistake as a researcher for extrapolating this as a country phenomenon.
- You may like to take a look at this publication:
Trends in Precipitation Extremes over India, U. R. Joshi and M. Rajeevan (2006)
which is a more comprehensive study, which incorporated 11 indices of extreme
weather out of the 15 formulated by the joint working group on climate change
detection of World Meteorological Organisation (WMO-CCL) and the research
program on Climate Variability and Prediction CLIVAR.
The results
suggested only the west coast (8 out of 11 indices) and to a lesser extent,
northwestern parts of the peninsula (4 out of 11 indices) showed some degree of
positive significance. See extracted table of UR Joshi and M Rajeevan
\
Your Ref: Trends in
the Rainfall Pattern over India, P. Guhathakurta and M. Rajeevan, 2007
Max you gave only the weblink to the abstract
of this study in your draft. However, I found the full study on the net. You
can access the detailed report here. Nevertheless,
I could not find the particular quote you credited to the authors even after
searching the whole report.
Unlike the Goswami study, this is a more
representative study conducted by the Indian Climate Centre, India
Meteorological Department, Pune that covered all the meteorological divisions
in the country. It found:
“The alternating sequence of multi-decadal periods having frequent
droughts and flood years are clearly noticed. We can delineate (i) 1901-1930
dry period (ii) 1931-60 wet period (iii) 1961-90 Dry period (iv) 1991-2020
(possibly) Wet period.”
The AGW theory states that global warming
induces an increase in global precipitation through the augmentation of water
evaporation. Warmer seas should heat up the monsoon winds that carry moisture
from the ocean to the land. In turn, warmer winds should carry more moisture,
so warmer oceans should lead to more rain.

The results
suggested only the west coast (8 out of 11 indices) and to a lesser extent,
northwestern parts of the peninsula (4 out of 11 indices) showed some degree of
positive significance. See extracted table of UR Joshi and M Rajeevan
However, what does this study actually says?
It says that the total rainfall during Indian monsoons is stable but with a
slight tendency towards a negative mean departure. This practically falsifies
the AGW hypothesis!! See the table for a modified extract from this study.
What could be the probable reasons for India
experiencing a slight rainfall deficiency? Unlike the scenario painted by the
AGW theory, it could well be that the monsoons are depositing precipitation
unto oceans relatively more than it used to and depositing relatively lesser
amounts unto landmasses. We saw such a phenomenon occur during Cyclone Phet
where most of its rains poured into the Indian Ocean. Whether this is a trend,
is for future researchers to throw light.
Of course, the 30-year period 1990-2020 has
yet to be completed and further the data provided is only until year 2003. It
is still possible that a full data-set could confirm the 30 yr natural
oscillation trend and 1990-2020 could still turnout to be a pretty wet period.
Nevertheless, the study also highlights though the macro level total rainfall
remains fairly stable, its monthly and spatial distribution pattern shows some
changes:
“June rainfall is getting importance as its
contribution to annual rainfall is increasing in almost 19 sub-divisions while
decreasing in the remaining 17 subdivisions. Contribution of July rainfall is
decreasing in central and west peninsular India. But contribution of August
rainfall is increasing in all these areas......
During the southwest monsoon season, three subdivisions viz. Jharkhand,
Chattisgarh, Kerala show significant decreasing trend and eight subdivisions
viz. Gangetic WB, West UP, Jammu & Kashmir , Konkan & Goa , Madhya
Maharashtra, Rayalseema , Coastal A P and North Interior Karnataka show
significant increasing trends.”
NGOs and environmental organizations had long
been agitating for climate justice. How do they define justice? They want more
funds for their organizations and reduction of CO2 emissions! The obsession
with both makes them lose sight of the fact that the "climate" in
many cases is already dispensing re-distributive justice – it reduces rainfall
in traditionally high rainfall areas like Kerala and increases it in low
rainfall areas such as north interior Karnataka and Rayalseema.
Consider how lucky Barmar, in the middle of
Thar Desert is, being favored by the rain god. Compare this with the plight of
desert populations in other parts of the world - the Dashti Kbir desert in Iran
has seen a 16 per cent drop in rainfall in the past 25 years, the Kalahari a 12
per cent decline and Chile's Atacama desert an 8 per cent drop. If this is
"climate change," why not have more of it?? However, this is a
too inconvenient fact for Indian environmentalists and NGOs. They suppress the
fact that "climate change"
in India's case has also an extremely benevolent face, fearing loss of public
support for their cause within the country.
You may like to read “Urbanization signature in the observed heavy
rainfall climatology over India by C. M. Kishtawal, Dev Niyogi, Mukul Tewari,
Roger A. Pielke Sr, J. Marshall Shepherd, November 2009.
This is a path-breaking study that
investigated the links between urbanization and Indian monsoon rainfall changes
by analyzing in situ and satellite-based precipitation and population datasets.
The study showed a significantly increasing trend in the frequency of heavy
rainfall over urban regions of India during the monsoon season. Urban regions
experience less occurrences of light rainfall and significantly higher
occurrences of intense precipitation compared to nonurban regions. Rather than
climate change, the study attributes changes in rainfall pattern to the urban
heat island effect.
Cyclones
“Due to warming sea surface temperatures, the number and intensity of
cyclonic storms over the north Indian Ocean - and other oceans - have shown an
increasing trend in the past three decades. One study (Webster et al. 2005)
found an increasing trend in the number of category 4 (wind speed of 56 to 67
metres per second) and 5 (above 67 metres per second or 241 kilometres an hour)
hurricanes in the north Indian Ocean, among other places. During 1975-1989
there was only one such event but in the 1990-2004 period there were seven,
amounting to a quarter of all events”.
Several other studies share Webster’s
conclusions. Similarly, there are even more number of authoritative studies
that counter these conclusions. Papers disputing the global existence and/or
magnitude of a trend towards stronger hurricanes include:
*
Landsea, C.W. et al. 2005. Hurricanes and global warming. Nature 438: E11-13.
Emanuel mishandled data and his methodology is flawed.
* Landsea, C.W.
et al. 2006. Can we detect trends in extreme tropical cyclones. Science 313:
452-454. The apparent trend towards more powerful hurricanes is a consequence
of improved monitoring in recent years of non-landfalling hurricanes.
* Klotzbach, P.J.
2006. Trends in global tropical cyclone activity over the past twenty years
(1986-2005). Geophysical Research Letters 33 doi: 10.1029/2006GL025881. From
1986 to 2005, there was an increase in hurricane strength (”accumulated cyclone
energy”) in the North Atlantic, a decrease in the Northeast Pacific, and not
much change in the other four hurricane basins.
* Swanson, K.L.
2007. Impact of scaling behavior on tropical cyclone intensities.
Geophysical Research Letters 34 doi: 10.1029/2007GL030851. There is no
statistically significant correlation between sea surface temperatures and
average tropical cyclone intensity in either the Atlantic or western Pacific
Ocean from 1950 to 2005.
The most cited of these had been those of
Ryan Maue of Florida State University who measured the frequency, intensity and
duration of all hurricanes and cyclones to compile an Accumulated Cyclone
Energy Index and found the energy index is at its lowest level for more than 30
years. (See graph)
The World Meteorological Organization
(WMO) had this to summarize of whether cyclones are linked to Anthropogenic
Global Warming (AGW):
"Though there is evidence both for and against
the existence of a detectable anthropogenic signal in the tropical cyclone climate
record to date, no firm conclusion can be made on this point."
The latest WMO research study is even more
categorical of a lack of link. Read here.
In its 2001 Report, the IPCC said there was
not enough evidence to conclude that humans contributed to hurricane activity.
Nevertheless, in its 2007 Report, they did a suspicious about turn, stating
with more certainty that the effects of global warming will likely cause future
hurricanes to be more intense, with larger peak wind speeds and heavier
precipitation.
Says Christopher Landsea who was one of the
authors of IPCC Reports until 2001 on hurricanes and cyclones:
“What the IPCC left out is that they only
looked at the data since 1970, but from the mid 1940s to 1960s we saw the same
thing we’re seeing now. Hurricanes look the same today as they did 50 years
ago.”
Landsea who is perhaps one of world’s best
authorities on cyclones/hurricanes quit as the lead author from the IPCC Report
2007 on the chapter on Cyclones/Hurricanes, charging IPCC "as being highly politicized and weak
on sound data". Along with him, Dr William Gray and some others
disagreed with the IPCC though they were part of the team authoring the IPCC
2007 report on Cyclones. In the process, IPCC’s claims on cyclones/hurricanes
are perhaps the weakest of all its claims as they are disputed even internally
within the IPCC.
However, what we know is that
cyclones/hurricanes have a similar oscillation period like the monsoons – a
quite phase and an active phase. El Niño is an extensive warming of the upper
ocean in the equatorial eastern Pacific lasting. The cooling phase is called La
Niña. El Niño events are linked with a change in atmospheric pressure known as
the Southern Oscillation (SO). Because the SO and El Niño are so closely
linked, they are known collectively as the El Niño–Southern Oscillation (ENSO).
The system oscillates between warm and neutral (or cold) conditions
approximately every three to four years.
ENSO also affects tropical cyclone activity.
In some regions an El Niño phase brings increases in tropical cyclone formation
(as in the South Pacific and the North Pacific between 140°W and 160°E), while
others tend to see decreases (as in the North Atlantic, the Northwest Pacific
and the Australian region). La Niña phases typically bring opposite conditions.
Landsea sees several reasons that ENSO should relate to cyclone activity: modulation
of the intensity of the local monsoon trough, repositioning of the location of
the monsoon trough, and alteration of the tropospheric vertical shear. Read
more here
“There
is evidence of faster melting and receding of Himalayan glaciers in future,
possibly affecting the flow of great rivers - the Indus, Ganga and Brahmaputra
- of the Indian sub-continent. Already in the higher reaches, like in the
Ladakh region, there are signs of water stress. There is not enough water from
the glaciers during the sowing period in April and May, so villagers in Leh
harvest spring water, freeze it and use it for planting seeds (Martin 2009).
Such
melting has tremendously increased the volume of glacial lakes, some of them
dammed by thin ice walls. Glacial lake outbursts can flood north India, Nepal
and Bhutan, discharging millions of cubic metres of water in a few days.
Scientists warn that with the melting of all the Himalayan glaciers there will
be a major water crisis in most of north India.”
Strange. I thought you would have read about IPCC’s fiasco on
Himalayan Glaciers. In one of our articles to the run-up of Copenhagen, we
categorically warned that Himalayan Glacier meltdown scare was no more than
reckless propaganda by foreign funded NGOs designed to panic the Indian
government into agreeing at Copenhagen in 2009. We were proved right three
months after making such a warning.
The IPCC has already apologized for their error. Glaciergate
was based on the story of unfounded speculation of a glaciologist back in 1999,
who now says he was misquoted in a brief telephonic interview!! His comments in
this telephonic interview, published in a report of the World Wildlife Fund
(WWF), were used as evidence of "catastrophic climate change" in the
IPCC’s 2007 Report.
What damaged IPCC most was the fact that the IPCC lead author who
approved the section admitted without remorse, “We did it because we thought it will impact
policy makers and politicians and encourage them to take some concrete action”. It confirmed climate sceptic’s
suspicion that IPCC was less about science and more about politics. And here
you are regurgitating much of the same discredited claims
made by the IPCC that was exposed without any scientific merit.
Having said that, I do not dispute what you personally encountered
in Leh. However, Dr AK Dubey of Wadia Institute of Himalayan Geology (WITG) in
an interview to Hindustan Times
provided a contrary example. He said:
“According
to a data for over 140 years available with a British weather observatory
situated in Mukteswar (2311m) in Almora has actually revealed that temperature
in that region witnessed a dip of .4 degrees... Our glaciers are giant high
altitude glaciers above 4000m altitude with a permanent temperature below 20
degrees Celsius.”
And yet, as there are as many as 15,000 Himalayan glaciers, there
is no comprehensive study on the state of health of these glaciers though we
know that their state health may not be all the same – some remaining
unchanged, some receding and others advancing. Moreover, as Jairam Ramesh
Environment Minister pointed out, “There
is no robust evidence to suggest that climate change is causing the retreat”
How much melt-ice feeds these river flows is contentious. Warmist
say melt-ice is the critical factor while we sceptics are of the opinion that
these rivers you mentioned are mostly dependent on the monsoons. We know
further that the Himalayan region is experiencing substantially increased
rainfall that can act as a compensatory factor to loss of melt-ice feeding the
river. However, the question whether this is enough compensation is of course
something that needs future studies to throw light.
Within this context, to give a picture of Himalayan glaciers as
receding as in your draft paper sounds a bit disingenuous. The IPCC fiasco has
highlighted how little is actually known about the fate of glaciers, specific
to this region. The errors were mainly based perhaps on the desire to pressurize
governments to sign the Copenhagen Treaty. However, we should know better if
there is no data, we should not be saying anything at all. This is why the IPCC
error on Himalayan Glaciers came as a big slap on the face of climate activists
in the country. It exposed them as just pretenders’ of knowledge.
Temperature Rise
“Considering
that 2005 was the second warmest year in the last 125 years and in the decade
preceding that, and nine out of the ten years were the warmest during the past
125 years, climate change is likely to become the most important environmental
issue in the 21st century (Srinivasan 2006).''
According to NASA, Mars ice caps are melting,
and Jupiter is developing a second giant red spot and parts of the planet are
6C warmer than a few years ago. Neptune's moon, Triton, studied in 1989 after
the unmanned Voyageur probe flew past, seems to have heated up significantly
since then. Parts of its frozen nitrogen surface have begun melting and turning
to gas, making Triton's atmosphere denser. Even icy Pluto has warmed slightly
in recent years. Its temperature is up -230C from -233C. Hmmm. Any thoughts on
these developments?

Back to your draft, I suppose if one depends
on surface-temperature data, one would probably come to the same conclusions as
the Srinivasan study did. However, there exists another set of temperature data
provided by satellites considered much more reliable, offering an unusually
high level (+ 0.1C) of accuracy.
What about the degree of consistency between
these two type of datasets? As the graph illustrates the slope is not zero,
indicating a degree of inconsistency between the data sets obtained from
satellite (UAH) and surface (GISS) sources. (Read more here). Surface-temperature
measurements tend to show much higher temperature averages than data based on
satellite ones.
We can come to different conclusions whether
the world is warming or not depending on our choice of datasets to base our
analysis. The references of your draft paper based their analysis on
surface-temperature. Accordingly, your paper paints a scenario of accelerating
global warming.
What if you had instead relied on studies
based on satellite based temperature measurements? You would have noticed a
clear absence of any statistically significant global warming trend
particularly after 1998, the very period that carbon dioxide emissions demonstrated
runaway growth. The AGW hypothesis as you know suggests that the more CO2
emissions pumped into the atmosphere, the higher the average global
temperatures. A lack of warming trend accordingly falsifies the AGW theory!
However, the problem with satellite data is
that they are only available from 1979 whereas surface temperature records go
back over 150 years. In India, these are available only from 1875. But
earth’s climate history goes back billions of years, making both kinds of
datasets inadequate to assess long-term temperature trends.
To overcome this problem, climate scientists
use various proxies to approximate temperatures of the distant past. Different
proxies may generate different temperature approximations and accordingly add
to the difficulty of generating a scientific consensus. The most famous
controversy of the misuse of proxies involved the UN Inter-Governmental Panel
on Climate Change (IPCC). In their first assessment report, the IPCC
categorically spelt out their technical reservations of the use of tree rings
as a temperature proxy. By the time of their third assessment report, they
broke their own rules to tout the “hockey stick graph” that used tree rings for
a large part of its methodology. This “hockey stick graph” was flaunted as the
foundation of the AGW hypothesis, which was eventually, exposed as the greatest
scientific fraud of this century.
NGOs and environmental organizations usually
consider the science as settled and wrongfully assume the surface-temperature
datasets on which they are based on as extremely reliable. The moot question is
what the scientific climate warmist community think of their own data quality.
Climategate emails revealed they appeared thoroughly terrified of the prospect
of public scrutiny of their data, prompting them to go great lengths to fight
off right of information requests and even took the extreme step of destroying
data to ensure that no one laid their hands on it. This type of bunker
behaviour does not reinforce conviction that these scientists even believed in
the quality of their own data though they publicly claimed it commanded a
reasonable degree of accuracy.
The World Meteorological Organization (WMO)
together with leading climate centres of the world has in fact launched a
project to revalidate all historical surface-temperature datasets even if it
needed reconstructing them again from scratch. Such a process could take 3-5
years (Read more here) We can ask,
why the need for this extreme step, if the climate scientific community held
high confidence in their own data? The reality is that public confidence levels
in surface temperature data hit at an all time low. Some of the factors
contributing to this fast erosion of public trust are:
1. The Climategate leaked emails included a file called Harrys.txt. A
diary of a computer programmer, it describes in detail how poor the data
quality standards were. The software programme (developed on an old FORTRAN
platform) was found too full of bugs that pathetically needed data to be
manually manipulated to get the “desired output”!
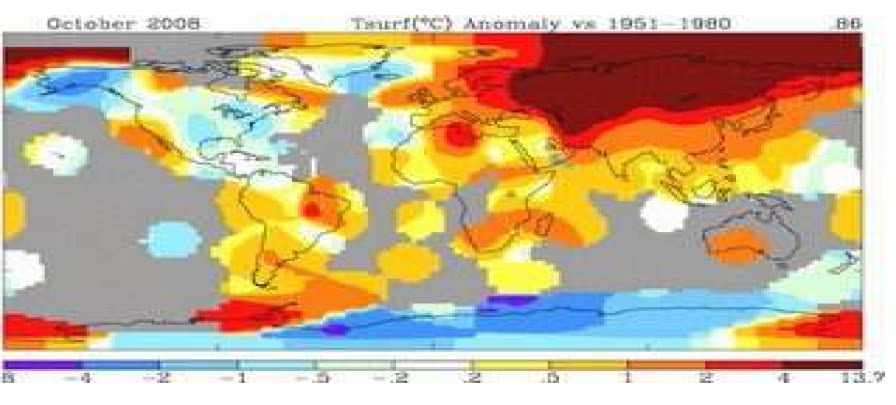
That some of the claims of warming records could be simply cases of data errors
is illustrated when the GISS claimed October 2008, as the hottest October in
global recorded history. Guess what when a climate sceptic checked out this
claim? It pointed to a significant data error. This expose led to a public
humiliation of the GISS who was forced to officially retract their claim!
And this was not the only time GISS was caught pants down, manipulating data!
2. The Climategate leaked emails also revealed that warmist scientists
were applying a “fudge factor” to raw temperature data in their analysis.
Climate sceptics then accessed raw data from various meteorological centres in
over 30 countries, in some cases, data that could be easily downloaded from
their websites.
Guess what they found? Analysis of raw data did not generate a warming
trend. Only when treated with the “fudge factor”, it does so. Granted that in
any quantitative analysis, some adjustments need to be made to ensure data
integrity; its impact logically should cut both ways. Instead, in country after
country, whether Russia, China, UK, Australia etc, the only trend this “fudge
factor” generated was one-way – warming and never cooling!
3. GISS and NOAA have besides officially reduced the number of their
temperature monitoring stations as much as 60-75% from 1990 levels. In Canada
for instance, the number of weather stations was reduced from 496 in 1989 to
just 44 in 1991 with the number of stations at lower (warmer) altitudes
tripling, leaving only one at a (cooler) higher elevation. In Bolivia, where
there haven’t been any weather stations for 20 years, the global weather
readings used by NASA-GISS, which should have produced a cooler average (given
its mountainous terrain), gave instead a much warmer reading because they are
estimated from nearby stations on Peruvian beaches and the Amazon jungle!!
Russia for example claimed the entire Siberia, one of the coldest regions
of the world, was excluded from the GISS dataset! If you keep on eliminating
colder stations and retain only the warmer ones in your dataset, is it any big
deal that you end-up with only record warming year after year, decade after
decade?? The only problem, who would believe them?
This kind of childish sampling manipulations
however makes mockery of the credibility of surface-temperature data-sets. Just
look at the GISS temperature world map.
Almost the entire Russia is shaded red where
the temperature anomaly for October 2008 was projected 13.7 degrees warmer than
the average for October over the period 1951-1980! Read here and here, how
sceptics gleefully pounced on the map to expose the unreliability of GISS data.
Just in case, you get the wrong impression to dismiss Russia as a one-off error
read here
of yet another instance of the GISS temperature map goof up. This time it was
Finland, provided just to illustrate the systemic nature of surface temperature
data flaws.
“Internationally, March 2009 became the hottest month recorded. The
combined global land and ocean average surface temperature for March 2010 was
the warmest on record at 13.5°C (56.3°F), which is 0.77°C (1.39°F) above the
20th century average of 12.7°C (54.9°F). This was also the 34th consecutive
March with global land and ocean temperatures above the 20th century average
(NOAA 2010)."
So?? I am sure you are aware of the
difference between weather and climate; one hot year, or cold winter proves
absolutely nothing, it is the trend over a longer period that counts. RR
Kelkar, a former ISRO Chair and member of WMO reminds us:
"When long-period climate normals are computed, extreme values get
averaged out, losing the attention they deserve. It is only when an extreme
event assumes the nature of a disaster, with heavy loss of life and property,
that it becomes a matter of importance, examination, discussion and of course,
controversy."
In fact, the period January to May this year
had been the hottest in satellite-temperature recorded history. Unfortunately,
it also holds no particular significance per se! You may ask why so. For a research
involving the study of climate, you need to put the year 2010 in true
perspective - this is the year of the El Nino. The IPCC Chair, Pachauri’s The
Energy Research Institute (TERI) singled out the El Nino as the most important
phenomenon that affects the climate in South Asia. Even NOAA you referred to
you concedes that much of this year’s warming is attributed to the El Nino
effect, a natural phenomenon.
The El Nino occurs once every 3-4 years, with
one out of their every four occurrences proving exceptionally strong. As the
above graph illustrates, the last super El Nino was during the period 1998-99.
Every time this happens, average global temperatures tend to spike steeply. The
latest El Nino, though starting out initially weak, gained strength progressively.
Began last June, it ended around April.
There is a time lag of a couple months before
we see average temperatures of the lower atmosphere start declining again. El
Nino year temperature spikes are blips that statisticians prefer to call as an
outlier that requires temperature curve smoothened out to avoid its distorting
effect.

What is more interesting to take note is the
post-El Nino global temperature behaviour that is usually conditioned by a
reverse phenomenon called la Nina. If the past is any indicator, we should soon
see global temperature anomaly turn negative as illustrated in the 2007-08 El
Nino graph below before slipping once again into some state of equilibrium
again, fluctuating within a narrow temperature band. The sharp temperature
decline induced by la Nina conditions, as in the case of the El Nino
temperature spike is to be treated as a blip and statistically considered an
outlier.
The good news (or is it bad news for
warmist?) Max is that the SST (Sea Surface Temperature) has already plunged and
still expected to plunge further in the months ahead. NOAA, who you quoted as a
source of global warming temperature records, has already declared a la Nina
watch. Average temperatures this month (June) is already significantly off
their highs of this year and if the past is any indicator, we should see UAH
tropospheric temperatures also starting to drop like a stone, albeit a time lag
of a couple of months. I am sure Max you must be grateful that Bangalore has
returned back to its air-conditioned weather after a scorching summer.
However, a scorching summer is perhaps a
reliable advance indication of a good monsoon season as the phenomenon is
driven by the difference in temperatures between landmasses in South Asia and
surrounding water bodies namely the Arabian Sea, the Bay of Bengal and the
Indian Ocean. The higher the land temperatures; the higher the difference
between landmasses and surrounding water bodies, As the pre-monsoon heat
builds up over the land mass, less dense air rises up, thereby forming areas of
low pressure, especially over North India and the Himalayas. At the same time,
the air over the ocean is cooler, and denser air remains at the surface,
thereby forming high-pressure areas. We have a problem with the monsoon wind
system whenever temperature difference between land and water temperatures is
narrower, as it happened last year.
The question remains, why does a +0.77C
temperature anomaly still strike fear in warmists and not to sceptics? The
difference is similar to the one between grass and astro-turf. Both look
indistinguishably green at a distance, but only a closer examination reveals
one as natural and other artificial. Sceptics believe in natural cycles and
warmists do not. Tell me, can anyone be “Green” if they discount the
over-powering influence of natural cycles? For example, assuming we accept AGW
alarmist claims that climate change has adversely affected the character of
monsoons (rainfall) how is it then the SW Monsoon, with rare exceptions, always
manages to keep its arrival in India on the dot??

And Max, given the earth is billions of years
old, have you ever asked how this +0.77C temperature anomaly compares to the
past temperature highs in Earth’s history? If you have not, you could look at
the graph above. Until 2001, even the discredited IPCC which you still
choose to quote from, acknowledged a Medieval Warm Period (MWP), some 1000
years back which was considerably warmer than present day. (See Red
curve)
It meant that Earth and humankind have
survived even much worse warming than present day. Phil Jones, the Director of
the Climate Research Unit of East Anglia who had been the eye of the
Climategate storm, even admitted in an interview that the world might have been
warmer during MWP. He should know best as much of the historical temperature
data the IPCC uses is from the Jones & Wigley dataset.
The Red curve was clumsily changed in the
third edition of the IPCC report and was replaced by another (Blue curve) that
took the shape of a hockey stick. The warming slope in modern day was made
steeper, and accordingly much more alarming. This revision meant that present
warming now became unprecedented in history! Presto - the IPCC completely
removed the MWP - a period where Greenland was so warm that Vikings gave
up warring as an occupation to take up farming and dairying. They also removed
a more recent period called the Little Ice Age wherein River Thames regularly
froze during winters. However, what they could not remove was the evidence of
these periods found in other related sciences and art disciplines – history,
geology, archaeology, literature, paintings etc. Fortunately, a retired
Canadian statistician exposed the hockey stick as a fraud, striking the first
hard blow to IPCC - a credibility knock from which they never really recovered.
The question is whether we should be giving
the IPCC the benefit of doubt. So first, let us first look at the background of
its parent body, the United Nations (UN) and we will find that it is the mother
of all scams of a global scale – Iraq Food-for-Oil; over-estimating multiple
times HIV-AIDS victims in the world and H1N1 Flu vaccine. Two months ago, we
had the case of a former UN under-general secretary, Shashi Tharoor, who held the
junior ministerial foreign affairs portfolio in the Indian cabinet being forced
to resign for his sleazy manipulation of the Indian Premier League (IPL) bid.
The incident perhaps throws some insight to the moral fibre of UN staff that
explains why UN is such a pathetic institution that it is.
In all these frauds, the UN collided with
industry, academics, corporate controlled media and some cases (HIV/AIDS), even
NGOs. The European Union is now investigating H1N1 Flu Vaccine fraud. Lest we
forget, they were the same institution that gave us too the slaughter in
Darfur; the Rwandan genocide; rape and child pornography in the Congo, Haiti,
Liberia, and Sudan; and, most recently, ties to a North Korean
currency-counterfeiting racket!
Next, we can look at the background of IPCC
itself. We could start from its charter:
“To assess on a comprehensive, objective, open and transparent
basis the scientific, technical and socio-economic information relevant to
understanding the scientific basis of risk of human-induced climate change, its
potential impacts and options for adaptation and mitigation”
If climate change was so important a life and
death issue as it made up to be, shouldn’t we be studying it in its entirety?
Instead, the IPCC was established to solely focus on an anthropogenic global
warming, embedding in it, a strong vested interest in promoting claims that
would guarantee its funding and justify its continued existence. The scam
starts by first proclaiming the conclusion as a factual truth (anthropogenic
and not natural factors are behind global warming) and then sets out to search
for evidence to validate such a conclusion! Initially in this search for
evidence, what they established was that the MWP was much warmer than present
day. Being an inconvenient fact to realize their agenda, so off it (MWP) went
and it was replaced by a fabrication (hockey stick graph).