For the last 3 months, the global average lower tropospheric temperature anomaly was hovering around the +0.30 deg C range. For September, 2011 it retreated a little again, to +0.29 deg. C (click on the image for the full-size version). The monthly statistics suggests the Tropics are where the positive anomaly is found the least.
Global sea surface temperature AMSR-E data for October 3 suggests it’s on its lowest from which satellite measurement commenced in 2003. Meanwhile all atmospheric indicators are touching on La Niña thresholds, with NINO3.4 at -7 and the 30-day Southern Oscillation Index (SOI) at +11.4.
Cloudiness near the Date Line remains suppressed since April 2010 when the La Niña first appeared indicating that there is no respite indicating that the drought in Texas and East Africa shows no hope of receding.[Cloudiness along the equator, near the Date Line, is an important indicator of ENSO conditions, as it typically increases (negative OLR anomalies) near and to the east of the Date Line during an El Niño event and decreases (positive OLR anomalies) during a La Niña event.]Historically, global temperature lag the La Niñas/El Niños by 3 to 6 months and accordingly it is likely that we see a more dramatic drop this month (October) as the effects of the La Niña start kicking in.
There are indications that the winter jet pattern too may settle in early. Switzerland for example has already received snow early last month. Winter may prove "catastrophic" (apologies for borrowing the favourite term of climate alarmists) in a number of geographies.
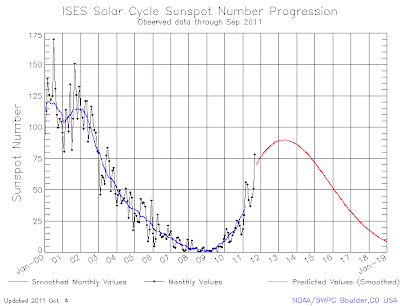
But the caveat is that NOAA’s Space weather prediction center released their solar cycle progression updates, and it shows one of the largest jumps for all common solar metrics since cycle 24 began. The sunspot number jumped significantly due to the recent large sunspot group that released X-class flares.Whether the sunspot number will decline or increases in the months ahead can depend how cold or warm winter will be.


No comments:
Post a Comment