

- At least 3,000 people have been killed and infrastructure has been wiped out in country's northwestern Khyber-Pakhtoonkhwa province that has been hit by floods and rainstorms, triggering the worst deluge in the region in eight decades. It is estimated that more than 2.5 million people desperately need help. The floods came after what meteorologists described as an "unprecedented" 30cm of rain fell in just 36 hours. Farm production in Pakistan may drop 10 percent to 15 percent because of damage caused by floods, Nasir Cheema, president of the agriculture chamber of commerce, said. The River Indus burst its banks.
- The same weather system is also responsible for flooding in bordering Afghanistan, where 65 people have died, and 61 were injured according to Abdul Matin Adrak, head of disaster management for Afghanistan.
- Thousands of families have been displaced following a chest-deep flash flood caused by heavy downpour that hit several parts of southern Philippine province of Maguindanao, the country's National Disaster Coordinating Council (NDCC) said. At least 8,200 families remain troubled by floods caused by continuous heavy rains in Sultan Kudarat town in Maguindanao provinces.
- Described as the country’s worst floods, it affected its northeastern and northwestern regions. At least 134 million people across 28 provinces have been impacted by the weather, which killed hundreds and cut off water supply to over 300,000 people. China's worst flooding in more than a decade may cut production of rice and cotton, analysts including Li Qiang, managing director at Shanghai JC Intelligence Co., said this week.
- In its first wave, monsoon cast its spell on the entire north India with several States receiving heavy rainfall, throwing normal life out of gear. Incessant rains in Punjab, Haryana, Delhi, Himachal Pradesh, Chandigarh and Uttarakhand led to disruption of movement of various trains, cancellation of flights, loss of lives and properties. Much of UP is in a state of flood like situation.
- The government declared a state of emergency because of the cold wave gripping a number of districts in 16 of the nation’s 24 regions, according to an urgent decree published. According to official figures, so far this year at least 409 people have died of pneumonia and ailments related to the cold weather, most of them younger than 5 years old (200 deaths) and over 60 years (158 deaths)
- The unusual heat has triggered a number of forest fires in Russia. Fires in central Russian regions had burned down more than 900 houses and killed at least five people, the Russian Emergencies Ministry announced. Moscow witnessed a record 37.7 degrees Celsius, the hottest in 130 years. The city is covered in smog from forest and peat fires in areas surrounding the capital. Russia's worst drought in at least 50 years has cut grain production and now threatens sowing plans for winter crops, the country's national weather centre said yesterday. Global prices for wheat shot up in anticipation of shortfall in Russia - the world’s third largest exporter.
- The United Nations said that more than 10 million hungry people across Africa's drought-stricken Sahel region need help and appealed for $230 million for impoverished Niger, which has been hardest hit. Niger, one of the poorest countries in Africa, has been most severely affected, with more than 7 million people — almost 50 per cent of the population — suffering from a lack of food, U.N. humanitarian chief John Holmes said.
- Melbourne is within reach of its longest cold snap in 14 years and so is Victoria’s capital, which will mark its longest cold stretch since 1996. The recent run of cold night weather in Perth could soon become the longest spell on record as the city shivers through its coldest June in 15 years.
According to NOAA, El Niño/La Niña-Southern Oscillation, or ENSO, is a natural phenomenon that occurs across the tropical Pacific Ocean on average - 3-4 years. It is characterised by variations in the temperature of the surface of the tropical eastern Pacific Ocean - warming or cooling known as El Niño and La Niña respectively - and air surface pressure in the tropical western Pacific - the Southern Oscillation. The two variations are coupled: the warm oceanic phase, El Niño, accompanies high air surface pressure in the west Pacific, while the cold phase, La Niña, accompanies low air surface pressure in the west Pacific.
“North America and the western Pacific are the two areas that see the greatest effects from a La Niña," Mike Pigott, a meteorologist with Accuweather Inc, Pennsylvania, said in an interview. "As things continue to develop you are likely to see more effects from this."
However, not all of these extreme events are associated with ENSO. Melbourne-based climatologist Lynette Bettio in a press interview pointed out: “The developing La Niña was unlikely to have driven the heat wave in Russia or flooding in Pakistan”.Following the rapid dissipation of the 2009/10 El Niño in early May 2010, a brief period of neutral conditions prevailed, that soon lead to a state of borderline La Niña conditions. These borderline conditions strengthened considerably during June-July and are now progressing as a basin-wide La Niña episode, expected to be formally declared anytime this month. It is important to recognize that while the state of El Niño or La Niña may be the most important factor leading to climate risk assessments in many regions, climate extremes may also develop because of ocean/atmosphere interactions outside of the tropical Pacific domain.
The popular climate sceptic blog, Watts Up With That? who broke the story, promised to make this their headline story for the next few days.

The legendary master weatherman, astrophysicist and leading climate sceptic, Piers Corbyn, attributed some of the recent extreme events to Coronal Holes or areas where the Sun's corona is darker, colder, and has lower-density plasma than average. Coronal holes are linked to unipolar concentrations of open magnetic field lines. The fast-moving component of the solar wind is known to travel along open magnetic field lines that pass through coronal holes. Not only did Piers Corbyn predict these events in advance but also as usual, he hit the bulls-eye. Here’s extracts from his latest weather bulletin:
“We specifically predicted the heatwaves and thunderfloods for much of Europe & West Russia (see http://www.weatheraction.com/docs/WANews10No28.pdf) and our current Euromaps forecast – via http://www.weatheraction.com/member.asp shows that heatwaves and hot weather in much of Russia will largely continue to mid-August and then sharply decrease and end completely - turning cool - in the last week of August. The change in solar-magnetic lunar state and corresponding shifts in the jet stream and Total Weather State of the world around mid-August will, we expect, also end the super-intense monsoon rains in Pakistan.
These extreme weather situations and events - which happen simultaneously around the world - are driven by events on the sun in our predicted Solar Lunar Action periods (SLAPs). This weather - and climate change - are entirely driven by Solar-Magnetic Lunar effects and are nothing to do with CO2. Heat waves in Russia and floods in India/Pakistan and England happened in similar solar-magnetic-lunar states about 132 years prior to current/ recent episodes of similar solar-magnetic (6X22=132yrs) & eclipse (7x19=133) cycles. [NB China not same]”
How Strong will be the La Niña?Though climatologists tell us that each La Niña is different, it does not stop the speculation whether it can turn out be a strong or a weak one. The reasons fueling these speculations this time arise from the unique behaviour of the current La Niña formation.
It is to be kept in mind that the potential predictability for this climate oscillation is not known. Some climate simulation models produce PDO-like oscillations, which has a chequered record. Nonetheless given here is the analysis of some of these climate simulation models.
Normally there is time lag between the decline of El Niño and the onset of La Niña. This time according to Dr. Michael Mann, this had been the fastest transition from El Niño to La Niña in the entire recorded history. (Mann was incidentally the creator of the infamous ‘hockey-stick graph’ that was used by the IPCC to be flaunted as the foundation to the global warming theory, but later was exposed as a fraud). This fact alone was responsible for stimulating all kind of speculations about the coming La Niña’s intensity whether it could be one of the strongest in recorded history.

As seen in the graph, the upper-ocean heat content increased sharply during October 2009 in association with the strengthening of El Niño. The anomalies decreased beginning in late February 2010 becoming negative by late April. The large negative anomalies during June and July are consistent with a developing La Niña.
The Southern Oscillation Index, (SOI) compares surface pressure over Darwin Australia with pressure over Tahiti. If this value is negative for an extended period of time it indicates average, surface pressure is lower over Tahiti and higher over Darwin. Positive values over longer times indicate La Niña. The greater the negative or positive value, the stronger the ENSO (El Niño Southern Oscillation) configuration (be it El Niño or La Niña).
The Australian Met Department confirmed a spectacular SOI Index jump that increased in value to 21. This is significantly up from a five-month running mean of 7, centred on May. The SOI, which has been positive since April, is at its highest monthly point since February 2008. Sustained positive values of the SOI above 8 indicates a La Niña event and its current 21 value indicates a possible very deep sized La Niña episode in the offing. However, we need to wait the coming weeks and months to confirm whether this early SOI advance is maintained or retreats. However, given its historical trend, one would expect it to only strengthen even further.
According to NOAA, the latest weekly (ending 28th July) Surface Sea Temperatures (SST) departures are:Niño 4 -0.8ºC
Niño 3.4 -1.3ºC
Niño 3 -1.4ºC
Niño 1+2 -1.9ºC
As seen in NOAA’s weekly SST departures, these numbers are much bigger anomalies than the last El Niño, giving rise to suspicions that this could be a much bigger La Niña than a -1.8ºC which is 4/10's deeper than the 2008 La Niña and 2/10's deeper than the 2000 La Niña.
In addition, the sea surface temperature (SST) varies much more slowly than atmospheric temperatures due to the heat capacity of water. As such, the SSTs lag the atmospheric temperatures on a seasonal timescale by about 3 months. Since La Niña formation began in May, a lag of 3 months means that from August we should start seeing a drastic drop in global average temperature anomalies. The cooling effect of the La Niña from now accordingly becomes increasingly visible. This is particularly so if we additionally factor in Piers Corbyn’s prediction (assuming it accurate) that heat waves in the Northern Hemisphere would also greatly abate by end of August; the Southern Hemisphere already cool.

The NINO3.4 index is yet another of several El Niño/Southern Oscillation (ENSO) indicators based on sea surface temperatures. NINO3.4 is the average sea surface temperature anomaly in the region bounded by 5°N to 5°S, from 170°W to 120°W. This region has large variability on El Niño or La Niña time scales, and is close to the region where changes in local sea-surface temperature are important for shifting the large region of rainfall typically located in the far western Pacific.An El Niño or La Niña event is identified if the 5-month running-average of the NINO3.4 index exceeds +0.4°C for El Niño or -0.4°C for La Niña for at least 6 consecutive months. As seen from the graph, NINO3.4 index is a whooping -1.3°C in less than 3 months, providing yet another indicator that suggests that it could be a big and deep La Niña season in the offing.

Dr. Roy Spencer, an extremely renowned astro-physicist and climatologist, who published the above SST graph, noted,“The cooling in the Nino34 region in the tropical east Pacific continue to be well ahead of the cooling in the global average SST, something we did not see during the 2007-08 La Niña event.”This implies that the pace of cooling in the in the Nino34 region is extremely rapid, not normally seen, and sooner than later will drag the global average SST with it. Of particular interest are the sub surface temperatures in of the Pacific showing a large area 5°C under normal, which is one of the reasons for some to conjecture a Super La Niña.

So how real are these expectations of a Super La Niña? David Hagen a climatologist helps us by shedding some light.“The rate of decline for Nino 3.4 is particularly remarkable, at about 5 K/decade. This appears faster than all the declines since 2002.”However, by plotting the above graph he illustrates that the current La Niña though likely to be the strongest for this decade, still fall far short of the strength displayed by 1998-01 La Niña or the Super La Niña of 1973. Nevertheless, these are early days since the La Niña is still in formation and may surprise one and all of its eventual strength.
On the other hand, the two super La Niñas in the recorded history both produced annual average temperature drops in excess of 3°C took almost 3 years to fully realise it. However, majority of statistical and dynamical models predict the current La Niña to be much shorter live. Almost all models forecasting negative SST anomalies extending through to the end of the year and lasting of La Niña residual conditions until middle of next year. Probabilistic predictions from the consolidated forecast indicate a high likelihood of development of a La Niña winter as it coincides with the period of its largest potential impact. It also suggests that there perhaps may not be much of summer in the Northern Hemisphere next year. For those in the Southern Hemisphere, 2011 could be the start of milder summers in the coming years.

The forecast of ENSO from various statistical and dynamical models are consolidated by IRI as above. Since Nino3.4 SST anomaly has already crossed -1.3°C , only a handful of forecasts within the shaded portions values as of date conforms to observed values of the current La Niña development viz. these are all forecasts all tending to indicate a big sized La Niña.

On the other hand, it is interesting to find similar consolidated forecasts by Climate Forecasting System (CFS) of NOAA actually showing a few forecasts that goes below -3°C - ranges of a super La Niña. However, these could be possibly only projections of worst-case scenarios. Lowest SSTs are usually observed in early spring and the highest SST anomalies in early autumn. However, notice in this case La Niña is forecasted to mostly peak around December. These forecasts additionally mostly project SST anomalies to be within the negative band even to next April and beyond that too. There exists a deep layer of below normal oceanic temperatures, extending from the surface to 250 meters depth throughout the Eastern Pacific, making it highly unlikely for SST anomalies to return to positive values by next summer.
These forecasts, their poor record of reliability aside, collectively suggest high probability for a severe winter and one where year 2011 is likely to be one of the coldest in recorded history.

The data displayed in this map provides the weekly average STTs as on 3rd August. In tropical regions, STTs of a value greater than 26°C are considered suitable for formation of tropical cyclones. The SST world map accordingly suggests that this period continues to display a high vulnerability to tropical cyclone formations in areas as shaded from orange to dark brown.
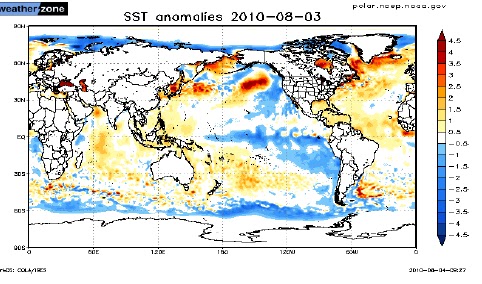
The sea surface temperature anomaly (SSTA) is the difference between the observed SST and the climatological SST. These anomalies are also calculated on a weekly basis, given their dynamic character. Positive SSTAs are usually correlated with increased regions of convection (cloudiness and rainfall) while negative SSTAs are usually correlated to reduced convection. It suggests at least during this week, we can expect the monsoon to reduce in its intensity for areas ranging from Africa to SE Asia, including S Asia. This means that we probably will not see at least this week, the likes of 35% above normal rains seen during the last week of July over India.
Will La Niña’s year long cooling make any difference to Global Warming’s Long Term Trend?The warmist argument is that even if we have a major La Niña, it really matters very little in the end. A deep La Niña will affect global temperature for a year or two at most and not much more, leaving global warming’s long-term trend unaffected. This is often based on the argument that La Niña gives the oceans a chance to "re-charge" since there is less heat loss. The result is that temperatures will ultimately bounce back. La Niña 1998/ 2001, when there was a long deep La Niña phase, excellently illustrates this behaviour. Their confidence additionally stems from most models of global warming, which predict not a steady climb in temperature, but higher average readings over time — and more record-breaking peaks than valleys.
The problem with this type of reasoning is that though temperatures did eventually bounced back, it lost its acceleration steam and the net result was the absence of any statistically significant warming over this decade. Further, a lack of statistically significant warming can also be looked as a prelude to a reversal to a cooling phase - a kind of a transition phase.

Moreover, the reason why temperatures recovered after La Niña 1998/2001 was mainly that the Pacific Decadal Oscillation (PDO) was positive. The PDO is a multi- decadal natural oscillation of the Pacific Ocean’s surface temperature and pressure. Indeed, since 1977, the PDO was positive as indicated by the Multivariate ENSO Index or MEI. We had shifted back into the cold mode in the late 1990s but a strong second solar maximum and a flurry of El Niños caused a bounce in the PDO again in the early 2000s. However, as the graph below indicates it appears to be strongly negative again since 2005, which should reinforce the intensity of La Niña now in progress
.

A positive MEI is one greater than 0.5 standard deviation and leads to El Niños, while a negative MEI in excess of -0.5 leads to La Niñas. As the following plot of the MEI shows, since 1977, El Niños have dominated over La Niña during a positive phase PDO. A warm mode of the PDO favours warm water in the ENSO region of the eastern tropical Pacific that encourages El Niños during this phase of the PDO. Similarly, a cool mode of the PDO favours cool waters in the ENSO region, encouraging La Niñas as seen in the table below.

Ingrid Ldeo in a paper compared the two climatic phenomena - ENSO and PDO:“The "Pacific Decadal Oscillation" (PDO) is a long-lived El Niño-like pattern of Pacific climate variability. While the two climate oscillations have similar spatial climate fingerprints, they have very different behavior in time. Fisheries scientist Steven Hare coined the term "Pacific Decadal Oscillation" (PDO) in 1996 while researching connections between Alaska salmon production cycles and Pacific climate (his dissertation topic with advisor Robert Francis). Two main characteristics distinguish PDO from El Niño/Southern Oscillation (ENSO): first, 20th century PDO "events" persisted for 20-to-30 years, while typical ENSO events persisted for 6 to 18 months; second, the climatic fingerprints of the PDO are most visible in the North Pacific/North American sector, while secondary signatures exist in the tropics - the opposite is true for ENSO.Several independent studies find evidence for just two full PDO cycles in the past century: "cool" PDO regimes prevailed from 1890-1924 and again from 1947-1976, while "warm" PDO regimes dominated from 1925-1946 and from 1977 through (at least) the mid-1990's. Shoshiro Minobe has shown that 20th century PDO fluctuations were most energetic in two general periodicities, one from 15-to-25 years, and the other from 50-to-70 years.”The PDO switches alternatively between cold and warm mode once every 25-30 years and has only recently switched back to a negative mode. Assuming that its effect will be similar to history, global climates can be expected to cool over the next 25-30 years. This is the reason why even some of the most prominent IPCC scientists like Mojib Latif, Prof Tsonis, William Gray and several more predicted the next 20-30 years as a cooling phase. Read here and here. Consequently, for the next 20-30 years, we can expect La Niñas to not only to display a greater frequency than El Niños but also a greater intensity of cooling. A vicious cycle is created - La Niñas reinforcing a cool PDO, which in turn reinforces La Niñas formation. This cycle continues until oceans sufficiently ‘re-charges’ to switch back once again into a positive phase.

In fact, the solar cycle appears a more important player than the PDO itself. As seen from the graph, for the period 1977-2001, solar irradiance (brightness summed across all wavelengths) and solar radio emissions had been unusually high correlating with warming the globe had experience. The sunspot average from 1900 to 1949 was 576 annually, and from 1950-1999 it was 876, an increase of 52%.Then came the slide, where sun activity became so quiet that it began to startle NASA who in an article commented the following:“The sunspot cycle is behaving a little like the stock market. Just when you think it has hit bottom, it goes even lower. 2008 was a bear. There were no sunspots observed on 266 of the year's 366 days (73%). To find a year with more blank suns, you have to go all the way back to 1913, which had 311 spotless days: plot. Prompted by these numbers, some observers suggested that the solar cycle had hit bottom in 2008.
Maybe not. Sunspot counts for 2009 have dropped even lower. As of March 31st, there were no sunspots on 78 of the year's 90 days (87%). It adds up to one inescapable conclusion:"We're experiencing a very deep solar minimum," says solar physicist Dean Pesnell of the Goddard Space Flight Center. "This is the quietest sun we've seen in almost a century," agrees sunspot expert David Hathaway of the Marshall Space Flight Centre.”

Solar activity comes in regular cycles, but the latest one is still refuses to start until very recently. Sunspots have all but vanished, and solar activity continues to be very quiet. The last time this happened was 400 years ago and it signaled a solar event known as a "Maunder Minimum," along with the start of what is now call the "Little Ice Age."
Pesnell however believes sunspot counts will pick up again soon, "possibly by the end of 2009 to be followed by a solar maximum of below-average intensity in 2012 or 2013”. Sunspots did rise briefly but collapsed once again. No one fully understands the underlying physics of the sunspot cycle. Except perhaps Piers Corbyn, the man described as making money out of sunspots through his company, Weather Action. He cooks a snook at climate alarmists by using a cheap scientific calculator for his calculations instead of super computers used by IPCC scientists and UK Met Office. The results tell their own story - Corbyn’s strike rate is over 85% while the latter’s often zero. His Solar Weather Technique combines statistical analysis of over a century of historical weather patterns with clues derived from solar observations. He uses a system of rules that tells you where to look in the past for relevant data, for similar weather patterns.
What we know is that during protracted periods of high sunspot activity, such as occurred in the Medieval Warm Period and the latter half of the last century, global temperatures rose. During the low points in sunspot activity, such as in the Little Ice Age, temperatures declined. The graphic below, prepared by Professor Don Easterbook, Western Washington University for his brilliant paper “Looming Threat of Global Cooling”, clearly establishes the correlation between global cooling and low solar irradiance and sunspots.

New research, by Robert Hodges and Jim Elsner of Florida State University, looked at the frequency of hurricanes and sunspots from 1851 to 2008 during the Sun’s 11-year cycles. During periods of low sunspot activity, the researchers discovered, the probability of three or more hurricanes hitting the United States increases dramatically. With fewer sunspots, there’s less energy at the top of the atmosphere, making for a cooler atmosphere above the hurricane. This differential fuels atmospheric instability, propelling tropical storms into hurricanes.
According to Antony Watts, the effect of sunspots on TSI (total solar irradiance) is negligible, but the reduction in the solar magnetosphere affects cloud formation here on Earth, which in turn modulates climate.The End of Climate Alarmism Soon

The Climate debate is poised for closure soon. This will not be based on solidity of theories or widening scientific consensus but simply because more and more people will realize that climate alarmism is in total variance with observed values. It is bad enough to reconcile to the fact that global warming, as we think we know it, does not exist. Imagine the people’s wrath when they discover that they actually face a looming threat of global cooling.
As history tells us, warming periods in earth's history have been ones where humankind has largely prospered due to higher crop yields. Cooling periods are the ones where humankind has historically suffered, from lower crop yields, hunger, disease and population decline. The Little Ice Age — actually three distinct cooling periods — chilled northern Europe and parts of the United States. It sent the Vikings scurrying back to Europe from their temporary colonization of Greenland. Glaciers invaded much of Norway and crop failures around Europe caused famines and spikes in grain prices. In 1816, New England experienced its "year without summer," when crops failed.
What is happening right now signals a similar drastic shift in the Earth's climate where we will likely to see drops in temperature in the coming years. This is because various natural climatic forces including the La Niña, PDO, solar activities etc are converging to bring about such a temperature dip. Russ Steele in his blog NC Media Watch describes such a convergence effect in the recent past that holds parallels for today:“The last time Iceland's Eyjafjallajokull volcano blew, the eruption lasted more than a year, from December 1821 until January 1823, according geologist at the Smithsonian Institution. It is interesting to note that 1821-1823 was the tail-end of the Dalton Minimum, falling in the minimum between the end of Sunspot Cycle Six and the start of Cycle Seven. Similar to the sunspot trough between Cycle 23 and 24 which we are currently observing. During the Dalton Minimum Europe experienced some very brutal winters and cool summers”

How deep will this change in climate be? Nobody knows for certain, but we know with more certainty that the warming phase of the world is over, and will not raise its head for another 20-30 years the very least.
Even a small negative temperature swing can trigger huge food production shortfalls affecting temperate regions including US, Canada, Russia, Ukraine and China - all-important global food production regions. We know from historical records that during solar minima, in these regions, the growth seasons were reduced, less sunshine were received and more rainfall fell during summers. Renowned environmentalist scientist Peter Taylor explains:“If that were not bad enough, we know from historical records that during these solar cold snaps, the monsoons over the Indian subcontinent were reduced and in some cases, completely failed. This effect is simultaneously affecting all monsoon activity regions in the tropics. Lower temperatures results in less water vapour in the atmosphere, leading to lesser rains. This reduction in rainfall does not start immediately. Instead it first manifests when the air and water temperature over the Pacific and over the Indian Ocean have dropped as the world cools. This is not a large drop in temperature, but still tends to lower the amount of water vapour in the tropics, which then cause drop in rainfalls. The reduction in the monsoons is more common when the temperature is at the lowest point during solar minima. It is also in effect when the temperature rebounds and the earth starts the warm up again at the end of the solar minima when the Sun once again becomes more active.
Therefore, what likely will happen is that first the food production in the food baskets of North America and Eurasia will be reduced. Then this is followed by a reduction of the harvests in the tropics, in countries like India, China and Brazil 5 to 10 years later, while at the same time the food production in the temperate regions of the World will continue to stay low.”The problem with being a one-issue movement is it only takes a single game changer to bring everything to a standstill. What will such a scenario cost the environmental and NGO sector that jumped on the gravy train of global warming, seeing this way forward to increase funding. Their staff latched on to the scam seeing this as a ticket for their career progression and the huge pay check and perks that it brought along. Then there is fame element above all. Boy they loved all the media attention and what all this did to their public profile. After all, what can be more effective PR than to help saving the world by informing the world of the dangers of dangerous global warming?If scientists massaged temperature data, to further their case, these environmental and NGOs outbeat them through their alarmist communications. They like the scientists began adopting assumptions of fudge relationships and projected them into as scientific proven facts. Their involvement in the issue led to the birth of apocalyptic environmentalism whose impact almost irreversibly damaged the long-term credibility of both environmental organizations and NGOs. And without credibility can we have effective advocacy?
These huge costs to their credibility and public faith could have all been avoided only if they heeded to the caution of Michael Griffin, the administrator of NASA:“I have no doubt that … a trend of global warming exists. I am not sure that it is fair to say that it is a problem we must wrestle with. To assume that it is a problem is to assume that the state of Earth’s climate today is the optimal climate, the best climate that we could have or ever have had and that we need to take steps to make sure that it doesn’t change.
First of all, I don’t think it’s within the power of human beings to assure that the climate does not change, as millions of years of history have show. And second of all, I guess I would ask which human beings—where and when—are to be accorded the privilege of deciding that this particular climate that we have right here today, right now is the best climate for all other human beings. I think that’s a rather arrogant position for people to take” (May 31, 2007).”


